When adopting a technical approach, traders seek opportunities across various time frames, capitalizing on fluctuations that occur within short-term and long-term durations. One valuable tool in technical analysis is chart patterns.
Chart patterns assist traders in anticipating potential price movements.
Examples of commonly referenced patterns include head and shoulders, ascending triangles, descending triangles, triple tops, and triple bottoms. More advanced chart patterns, such as harmonic figures, gartley patterns, bullish cypher, and bearish cypher, also exist.
Each pattern formation carries historical price expectations. However, it’s important to note that chart patterns do not guarantee outcomes and should not be viewed as infallible predictions. Instead, they provide reference points based on historical data, indicating probable movements.
Let’s explore a few chart examples to assist beginner traders in navigating price analysis. Please refer to the charts below, courtesy of Optimus Flow.
The line chart is the simplest form of charting, displaying a single line representing a specific time frame. It offers a straightforward visual representation of the trend but lacks detailed insight into the price action within that period. The line chart solely indicates the closing price based on the end of each time frame. For instance, you can utilize a 30-minute line chart, which reflects the closing price at the end of each 30-minute interval, or a 1-month line chart, which shows the closing price at the end of each month.
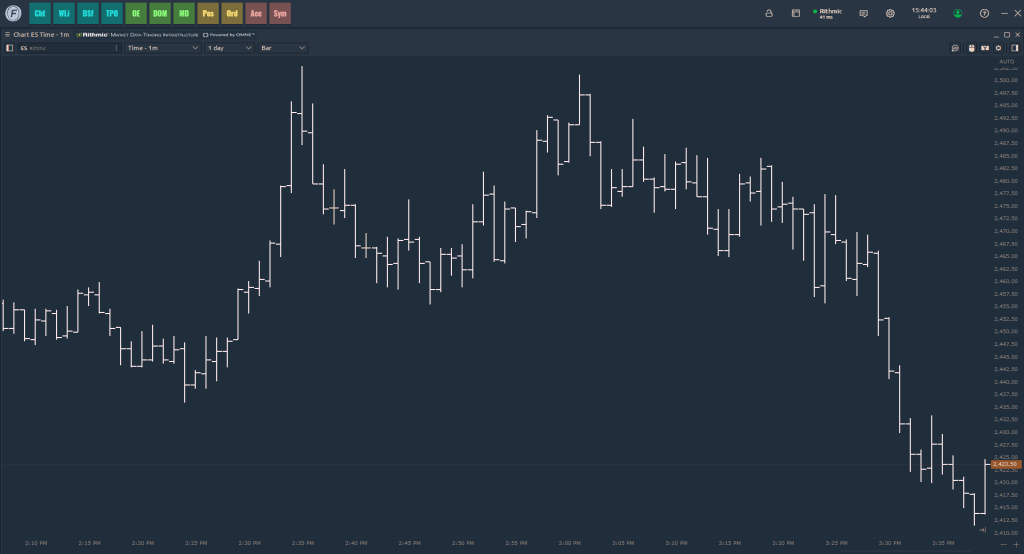
Bar charts introduce an additional layer of complexity by providing more data points and a comprehensive visual representation. In a bar chart, each vertical line represents a specific time frame. The top of the line indicates the highest price reached during that period, while the bottom represents the lowest price. Additionally, you will notice two small horizontal lines extending from the sides of the vertical line. The right-side horizontal line represents the closing price, while the left-side line indicates the opening price. Together, these elements provide a more detailed depiction of the price range and the opening/closing levels within a given time frame.
Selecting a charting method that aligns with your comfort level is crucial. When you discover the chart type that resonates with your trading style, you can then establish a strategy to recognize and capitalize on the patterns you observe on your chart. By finding the right fit, you’ll be able to enhance your trading approach and make informed decisions based on the patterns that unfold before you.
Candlestick charts introduce an additional dimension that is not present in bar charts. Each candlestick consists of a body, lower wick, and upper wick. The lower wick represents the lowest price reached during the specified time period, while the upper wick represents the highest price. A green or “bullish” candle signifies that the closing price is higher than the opening price, whereas a red or “bearish” candle indicates that the opening price is lower than the closing price. Candlestick charts provide valuable insights into price dynamics and offer a visual representation of market sentiment.
Point and figure charts hold a special place among traders, and those who incorporate them into their trading strategies testify to their effectiveness. These charts prioritize price over time. Point and figure chart enthusiasts use them to filter out market noise and focus on specific price levels that have been reached or surpassed. In point and figure charts, only X’s and O’s are displayed. X’s indicate that the price has surpassed a significant level, while O’s indicate that the price has fallen below a key level. Traders have the flexibility to set their own key levels based on their preferences, allowing for a personalized approach to analyzing price movements.